Tag Archive for: PSA

Posts

Article of the week: Dutch GPs influenced by ERSPC PSA study

Every week the Editor-in-Chief selects the Article of the Week from the current issue of BJUI. The abstract is reproduced below and you can click on the button to read the full article, which is freely available to all readers for at least 30 days from the time of this post.

In addition to the article itself, there is an accompanying editorial written by a prominent member of the urological community. This blog is intended to provoke comment and discussion and we invite you to use the comment tools at the bottom of each post to join the conversation.

Finally, the third post under the Article of the Week heading on the homepage will consist of additional material or media. This week we feature a video of Miss van der Meer and Dr Blanker discussing their article.

If you only have time to read one article this week, it should be this one.

Impact of the European Randomized Study of Screening for Prostate Cancer (ERSPC) on prostate-specific antigen (PSA) testing by Dutch general practitioners

Saskia Van der Meer, Boudewijn J. Kollen*, Willem H. Hirdes, Martijn G. Steffens, Josette E.H.M. Hoekstra-Weebers, Rien M. Nijman and Marco H. Blanker*

Department of Urology, Isala Clinics, Zwolle, and Departments of *General Practice, Psychosocial services and Urology, University Medical Center Groningen, University of Groningen, Groningen, the Netherlands

OBJECTIVE

• To determine the impact of the European Randomized Study of Screening for Prostate Cancer (ERSPC) publication in 2009 on prostate-specific antigen (PSA) level testing by Dutch general practitioners (GPs) in men aged ≥40 years.

MATERIALS AND METHODS

• Retrospective study with a Dutch insurance company database (containing PSA test claims) and a large district hospital-laboratory database (containing PSA-test results).

• The difference in primary PSA-testing rate as well as follow-up testing before and after the ERSPC was tested using the chi-square test with statistical significance at P < 0.05.

RESULTS

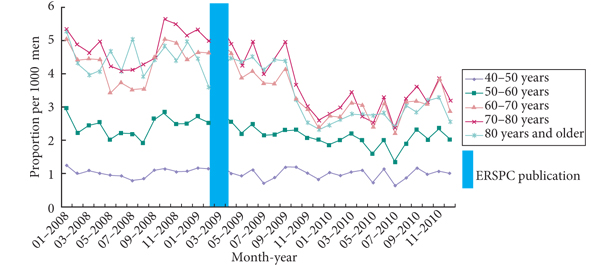
• Decline in PSA tests 4 months after ERSPC publication, especially for men aged ≥60 years.

• Primary testing as well as follow-up testing decreased, both for PSA levels of <4 ng/mL as well as for PSA levels of 4–10 ng/mL.

• Follow-up testing after a PSA level result of >10 ng/mL moderately increased (P = 0.171).

• Referral to a urologist after a PSA level result of >4 ng/mL decreased slightly after the ERSPC publication (P = 0.044).

CONCLUSIONS

• After the ERSPC publication primary PSA testing as well as follow-up testing decreased.

• Follow-up testing seemed not to be adequate after an abnormal PSA result. The reasons for this remain unclear.


Read Previous Articles of the Week


Editorial: Impact of ERSPC study on PSA testing in the Netherlands

General practitioner (GP)’s view on screening for prostate cancer in the Netherlands: the impact of a randomized trial

I am grateful to be given the opportunity to provide an editorial comment on a so-far unique publication investigating the impact of results of the European Randomized study of Screening for Prostate Cancer (ERSPC) on the attitude of Dutch GPs in requesting a serum determination of PSA in men aged >40 years. Access to data from one of the major health insurance companies and the structure and data acquisition of regional laboratories in the Netherlands provided an opportunity to carry out the project. This included the differentiation of age groups, of primary as opposed to repeat PSA testing and, in the case of the hospital database, of repeat PSA testing within 1 year, which provided the opportunity to address the primary goal of the study: the evaluation of the difference in primary PSA testing rates as well as follow-up testing before and after the 2009 publication of interim data from the ERSPC study. The fact that a Dutch translation of this publication and a recommendation by the Dutch Association of General Practitioners (Nederlands Huisartsen Genootschap, NHG) were mailed at the same time and the fact that GP guidelines had not been changed since 2005 in the Netherlands provided an important basis for the reported study.

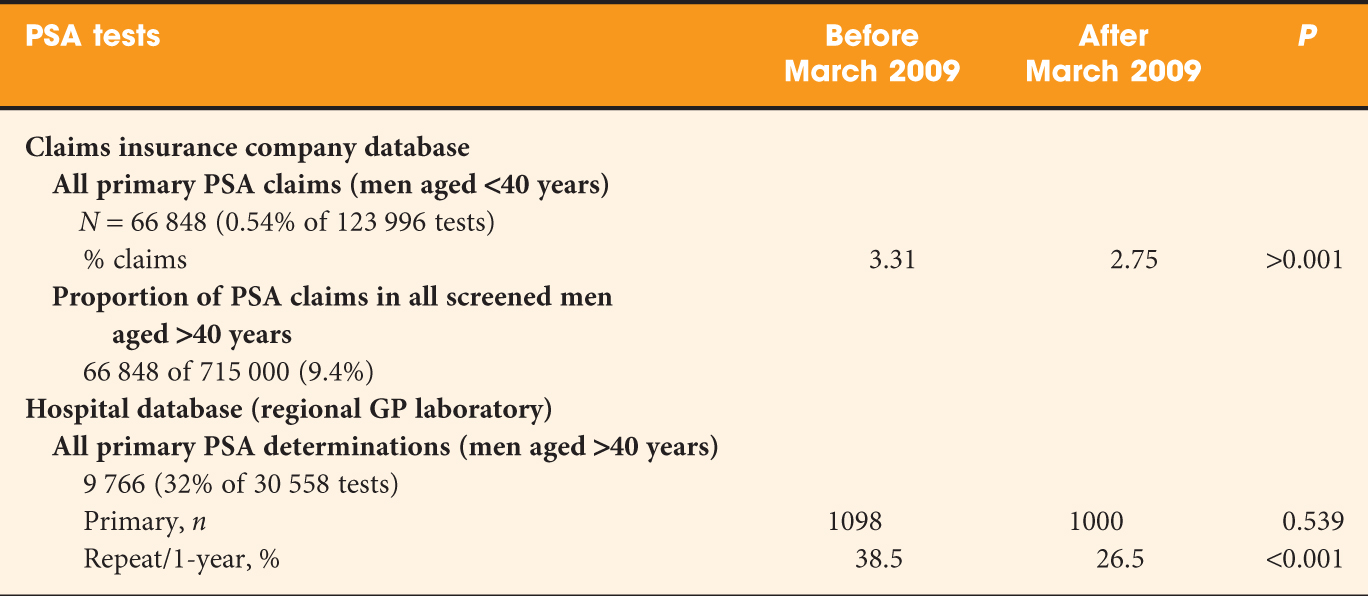
Two different databases were used and PSA testing was evaluated 1 year before and 1 year after March 2009 (excluding the month March 2009). An overview of the data acquisition and results is given in Table 1. In brief, the data based on insurance claims show a significant decrease in PSA use before and after the 2009 publication. This decrease was less pronounced or not seen at all in men aged 70–80 or >80 years. The study selectively identified men in the ERSPC region of Rotterdam after exclusion of those assigned for re-testing in the screening arm. In line with earlier investigations, the PSA testing rate in the Rotterdam region was considerably higher then in the rest of the Netherlands. This effect was blamed on increased awareness and possibly on the motivation of men randomized into the control group of the study. The so-called ‘hospital database’ refers to a regional GP laboratory. It remains unexplained why only 2098 men of the total of 9766 men who were identified as having undergone primary PSA testing (Tables 1 and 2 in the study) were included in the analysis. These data show that there was no overall difference in testing before and after the ERSPC publication, but the proportion of re-testing decreased significantly between the two periods.

Table 1: Data acquisition and results.

Several comments can be made on this study. First, information provided on the insurance claims database allows an estimate of the proportion of men in whom PSA is evaluated (123 996/715 000 = 17.3%) and of those who undergo primary PSA testing for early diagnostic purposes (66 848/715 000 = 9.4%). The overall figure contrasts sharply with the results of a study by the Central Bureau of Statistics in the Netherlands, published in 2006. The study shows PSA use of 30–40% for the age groups 60–70 years or older.

Second, as the authors acknowledge, the differentiation between primary PSA tests for the purpose of early diagnosis and for other purposes may not be entirely reliable; however, the bias resulting from possibly incorrect assumptions is likely to be small.

Third, the sub-analysis of data coming from the Rotterdam region is likely to show the impact of greater awareness resulting from written informed consent before randomization and the effect of randomization into a control group. The data confirm an earlier evaluation of this subject (reference 7 in Van der Meer et al.) and at the same time provide a rough estimate of the level of contamination which may take place in the ERSPC study, Rotterdam region.

Fourth, it is interesting to see how age and previous PSA values influence the request for repeat PSA studies. It is counterintuitive (Table 3 in Van der Meer et al.) that even in the critical PSA range 4–10 ng/mL a significant decrease of PSA use within 1 year was seen. The multivariate analysis shows that study period before and after 2009, PSA categories and age groups are all significantly related to the decrease of PSA re-testing within 1 year.

Finally, as one of the initiators of the ERSPC study, I should like to refer to two important follow-up publications (Schröder et al.Heijnsdijk et al.) that point to the over-diagnosis and over-treatment of prostate cancer as the main reasons why the almost 30% reduction in prostate cancer mortality in screened men cannot (yet) be used for establishing population-based screening. For these reasons, the authors fully agree with the viewpoint of the Dutch GP Association and the recommendation against routine use of PSA-driven screening for prostate cancer; however, as pointed out in the last sentences of their paper instruments are now available to decrease over-diagnosis and the rate of unnecessary biopsies. In addition to that, it should be realized that men who are well informed and wish to be tested for prostate cancer cannot be refused PSA testing. To assist this process, the International Society of Urology (SIU) and the international movement ‘Movember’ have recently made available on their websites a validated decision aid for men who wish to be tested, their GPs and their treating urologists.

Fritz H. Schröder
Erasmus Medical Center, Rotterdam, The Netherlands.

Read the full article

Video: PSA testing decreased in the Netherlands after ERSPC study

Impact of the European Randomized Study of Screening for Prostate Cancer (ERSPC) on prostate-specific antigen (PSA) testing by Dutch general practitioners

Saskia Van der Meer, Boudewijn J. Kollen*, Willem H. Hirdes, Martijn G. Steffens, Josette E.H.M. Hoekstra-Weebers, Rien M. Nijman and Marco H. Blanker*

Department of Urology, Isala Clinics, Zwolle, and Departments of *General Practice, Psychosocial services and Urology, University Medical Center Groningen, University of Groningen, Groningen, the Netherlands

Read the full article
OBJECTIVE

• To determine the impact of the European Randomized Study of Screening for Prostate Cancer (ERSPC) publication in 2009 on prostate-specific antigen (PSA) level testing by Dutch general practitioners (GPs) in men aged ≥40 years.

MATERIALS AND METHODS

• Retrospective study with a Dutch insurance company database (containing PSA test claims) and a large district hospital-laboratory database (containing PSA-test results).

• The difference in primary PSA-testing rate as well as follow-up testing before and after the ERSPC was tested using the chi-square test with statistical significance at P < 0.05.

RESULTS

• Decline in PSA tests 4 months after ERSPC publication, especially for men aged ≥60 years.

• Primary testing as well as follow-up testing decreased, both for PSA levels of <4 ng/mL as well as for PSA levels of 4–10 ng/mL.

• Follow-up testing after a PSA level result of >10 ng/mL moderately increased (P = 0.171).

• Referral to a urologist after a PSA level result of >4 ng/mL decreased slightly after the ERSPC publication (P = 0.044).

CONCLUSIONS

• After the ERSPC publication primary PSA testing as well as follow-up testing decreased.

• Follow-up testing seemed not to be adequate after an abnormal PSA result. The reasons for this remain unclear.


The new AUA PSA Testing Guidelines leave me scratching my head

The fact that Otis Brawley describes the new PSA testing guidelines of the American Urological Association (AUA) as “wonderful”, should immediately raise a red flag at AUA headquarters. Dr Brawley, Chief Medical Officer of the American Cancer Society, and the most vocal anti-prostate cancer screening voice in the USA over the past decade, has enthusiastically welcomed the new document and “commended” the AUA for bringing its policy closer to that of his Society. The Guidelines have also been compared to those of the United States Preventative Services Task Force (USPSTF) which completely opposes PSA testing in any situation – a position which the AUA called “inappropriate and irresponsible” just a few months ago. Oh dear – where has it all gone wrong? ?

For those who haven’t yet seen the document, here are the five statements issued by the Guideline committee at the Annual Meeting of the AUA in San Diego this week along with some of my thoughts in italics:

  1. The Panel recommends against PSA screening in men under age 40 years. This appears reasonable.
  2. The Panel does not recommend routine screening in men between ages 40 to 54 years at average risk. I have some problems with this (as do many others). In addition to this statement, the AUA highlights its view that the likelihood of causing harm is high and that any benefit is marginal. It appears to have completely dismissed evidence (and its own previous view), that a baseline PSA in men in this age group is highly predictive of future prostate cancer, metastasis and death. In my view, there is considerable value in having a baseline PSA in this age group and I am disappointed that the AUA has not recognised the evidence to support this.
  3. For men ages 55 to 69 years the Panel recognizes that the decision to undergo PSA screening involves weighing the benefits of preventing prostate cancer mortality in 1 man for every 1,000 men screened over a decade against the known potential harms associated with screening and treatment. For this reason, the Panel strongly recommends shared decision-making for men age 55 to 69 years that are considering PSA screening, and proceeding based on a man’s values and preferences. I agree with the emphasis here on shared decision-making, although the concept can be somewhat nebulous and difficult to achieve in real-life. However, I think that this statement somewhat over-emphasises the harms associated with PSA testing in this group. Rather than portray the reduction in prostate cancer mortality as being very minor (1 in 1000), men should know that when compared with a man who chooses not to have PSA testing in this age group, those who do have regular PSA testing have a 44% reduction in prostate-cancer mortality over a 14 year period. Furthermore, the numbers needed to screen (293) and number needed to treat (12) to save one life stack up very well when compared with other screening modalities such as mammography (Hugosson et al). Why has the AUA instead chosen to over-emphasise the harms? This is disappointing.  
  4. To reduce the harms of screening, a routine screening interval of two years or more may be preferred over annual screening in those men who have participated in shared decision-making and decided on screening. As compared to annual screening, it is expected that screening intervals of two years preserve the majority of the benefits and reduce over-diagnosis and false positives. This appears reasonable.
  5. The Panel does not recommend routine PSA screening in men over age 70 years or any man with less than a 10 to 15 year life expectancy. Yes, but this strong advice not to offer PSA testing in men greater than 70 belies the fact that many men in this age group have a long life expectancy (eg in Australia a male who reaches 70 has a 15 year life expectancy (www.abs.gov.au), and an early diagnosis of prostate cancer may prevent their untimely death from this disease. Clearly, not all men in their 70’s are the same but following this advice to the letter could deny many men the option of avoiding death from prostate cancer in later life.

Therefore, it appears that the only circumstances under which the AUA currently recommend a PSA test be performed is for men between the age of 55 and 69 following a weekend seminar so they can be adequately informed (or thoroughly confused).

These statements have led to headlines such as these in the mass media today:

  • Urology Group Stops Recommending Routine PSA Test (USA Today)
  • Looser Guidelines Issued on Prostate Cancer Screening (New York Times)
  • Urologists No Longer Support Routine Prostate Cancer Screening (Minn Post)
  • Most men don’t need PSA test (Arizona Star)
  • AUA No Longer Recommend Routine PSA Testing For Prostate Cancer (Huff Post)

I think it is reasonable to say that this AUA document adds more confusion than clarity to the debate around prostate cancer testing. It has certainly provoked some anger among prominent members of the AUA who voiced their displeasure to the Committee during the plenary and also through social media. Dr Catalona was first to the microphone asking why AUA members were not more widely consulted prior to publication and in particular, challenging the guidance around men aged 40-54 (reported on Twitter):


Dr Stacy Loeb also voiced her concerns at various sessions during the day:


Much progress has been made in the last few decades with a 30% reduction in prostate cancer-specific mortality since the introduction of PSA testing. And while we accept that this has led to a large amount of over-treatment of less aggressive disease, it is clear that (at least outside the USA), active surveillance is being enthusiastically embraced for appropriate patients. Any return towards the pre-PSA era would likely lead to a reversal in these mortality gains and we would again see many more men presenting to our rooms with incurable disease.

As Dr Smith editorialized in the Journal of Urology following the publication of the ERSPC and PLCO trials in 2009, “Treatment or non-treatment decisions can be made once a cancer is found, but not knowing about it in the first place surely burns bridges”. It is clear that many urologists consider these new AUA PSA Guidelines to be in danger of burning these bridges. However, rather than burn bridges, it is likely that urologists and others will ignore these guidelines and continue to counsel men in a more balanced fashion about the pros and cons of PSA testing. The AUA will then need to consider whether ignored guidelines are failed guidelines.


Prof Tony Costello is a Director and Professor of Urology at the Royal Melbourne Hospital, Melbourne, Australia.

Twitter: @proftcostello


Comments on this blog are now closed.


Every Month Matters: Living with Prostate Cancer


This video tells the story of Matt, who was diagnosed with advanced prostate cancer and told he only had two years to live. Nine years after he was diagnosed, Matt and his family share their experience of living with prostate cancer and how the diagnosis affected their lives.

Every Month Matters is a disease awareness campaign funded by Astellas Pharma Europe Ltd.

Please visit the campaign website Every Month Matters for more information.

BJUI have no conflict of interest. This video is posted for patient awareness.

The Flaws of the PIVOT Study of Radical Prostatectomy versus Observation; Don’t Give up on PSA Just Yet.

A recent editorial in the BMJ by Christopher Parker (Treating prostate cancer. BMJ 2012; 345: e5122) uses the “best available evidence” from the PIVOT study (Wilt TJ, et al) to argue the case for watchful waiting for low risk prostate cancer and question the need to diagnose the condition at all. Unfortunately the PIVOT trial was marred by a number of serious flaws that should make us doubt its conclusions.

The original design of the PIVOT trial included a randomisation of 2000 patients to surgery or observation (Prostate cancer, uncertainty and a way forward. NEJM 2012; 367: 270-1). Unfortunately, this goal was not achieved; the design was modified to justify a randomization goal of only 740 patients. Median survival was assumed to be 15 years in the original study design and 10 years in the updated version. If the median survival of 12 years in the study’s observation group is taken and 7 years for enrollment and 8 years of follow-up assumed, the sample requires 1200 patients in order to detect a 25% relative reduction in mortality with 90% power and a two-sided alpha level of 0.05. With an actual enrollment of only 731 patients, the study was consequently underpowered to detect this relatively large clinical effect. The wide 95% confidence interval around the hazard ratio for death in the treatment group illustrates this point. A relative increase of 8% to a relative reduction of 29% in the risk of death in the prostatectomy group, as compared with the observation group, cannot be excluded with 95% confidence. Only 15% of the deaths were attributed to prostate cancer or its treatment.

Although a “life expectancy of at least 10 years” was an entry criterion, by 10 years almost half the participants had died, leaving only 176 men in the surgery group and 187 in the observation cohort, and by 15 years only 30% were alive. The investigators therefore did not recruit healthy men who would be the normal candidates for surgery and randomize them to observation; instead they recruited elderly and co-morbid men with very limited life expectancy and randomised them to surgery (with one fatality!). Furthermore, the finding that one fifth of patients did not adhere to the assigned treatment further reduces the ability of the trial to discern a treatment effect.

Prostate cancer is a slowly progressive condition which eventually, and after many years, results in a painful death from metastases in a significant number of patients, unless mortality from other causes supervenes. Radical prostatectomy, now usually performed minimally invasively with robotic assistance (Goldstraw MA, et al), prevents disease progression in >80% of well-selected cases. We appear to manage localised prostate cancer in a much more holistic way than our American colleagues and MDT decision-making and robust active surveillance programmes have enhanced this. Others were also outraged by the Parker editorial and the intrinsically flawed results of the PIVOT study should definitely not encourage us to turn our backs on a disease that kills more than 10,000 men per annum in the UK and hundreds of thousands more worldwide.


Roger Kirby, Ben Challacombe and Prokar Dasgupta
The Prostate Centre, London W1G 8GT and Guy’s Hospital, King’s College London, King’s Health Partners


Comments on this blog are now closed.


Article of the Week: The New Partin Tables

Every week the Editor-in-Chief selects the Article of the Week from the current issue of BJUI. The abstract is reproduced below and you can click on the button to read the full article, which is freely available to all readers for at least 30 days from the time of this post.

In addition to the article itself, there is an accompanying blog written by a prominent member of the urological community. This blog is intended to provoke comment and discussion and we invite you to use the comment tools at the bottom of each post to join the conversation.

Finally, the third post under the Article of the Week heading on the homepage will consist of additional material or media. This week we feature a video of John Eifler and Alan Partin discussing their paper.

If you only have time to read one article this week, it should be this one.


An updated prostate cancer staging nomogram (Partin tables) based on cases from 2006 to 2011

John B. Eifler, Zhaoyang Feng, Brian M. Lin, Michael T. Partin, Elizabeth B. Humphreys, Misop Han, Jonathan I. Epstein, Patrick C. Walsh, Bruce J. Trock, Alan W. Partin

Read the full article
OBJECTIVE

• To update the 2007 Partin tables in a contemporary patient population.

PATIENTS AND METHODS

The study population consisted of 5,629 consecutive men who underwent RP and staging lymphadenectomy at the Johns Hopkins Hospital between January 1, 2006 and July 30, 2011 and met inclusion criteria.

• Polychotomous logistic regression analysis was used to predict the probability of each pathologic stage category: organ-confined disease (OC), extraprostatic extension (EPE), seminal vesicle involvement (SV+), or lymph node involvement (LN+) based on preoperative criteria.

• Preoperative variables included biopsy Gleason score (6, 3+4, 4+3, 8, and 9–10), serum PSA (0–2.5, 2.6–4.0, 4.1–6.0, 6.1–10.0, greater than 10.0 ng/mL), and clinical stage (T1c, T2c, and T2b/T2c).

• Bootstrap re-sampling with 1000 replications was performed to estimate 95% confidence intervals for predicted probabilities of each pathologic state.

RESULTS

• The median PSA was 4.9 ng/mL, 63% had Gleason 6 disease, and 78% of men had T1c disease.

• 73% of patients had OC disease, 23% had EPE, 3% had SV+ but not LN+, and 1% had LN+ disease. Compared to the previous Partin nomogram, there was no change in the distribution of pathologic state.

• The risk of LN+ disease was significantly higher for tumors with biopsy Gleason 9–10 than Gleason 8 (O.R. 3.2, 95% CI 1.3–7.6).

• The c-indexes for EPE vs. OC, SV+ vs. OC, and LN+ vs. OC were 0.702, 0.853, and 0.917, respectively.

• Men with biopsy Gleason 4+3 and Gleason 8 had similar predicted probabilities for all pathologic stages.

• Most men presenting with Gleason 6 disease or Gleason 3+4 disease have <2% risk of harboring LN+ disease and may have lymphadenectomy omitted at RP.

CONCLUSIONS

• The distribution of pathologic stages did not change at our institution between 2000–2005 and 2006–2011.

• The updated Partin nomogram takes into account the updated Gleason scoring system and may be more accurate for contemporary patients diagnosed with prostate cancer.

Erratum:

A typographical error was identified in Table 2, for the cell corresponding to the probability for EPE in a man with clinical stage T1c, PSA >10, and biopsy Gleason 4+3. The cell should read “38 (32-45)” rather than “28 (32-45).” Also, in the third paragraph of the Results section, the fourth sentence should be changed to “In contrast, the predicted risk of LN+ is no more than 3% for T1c tumours with biopsy Gleason score <9 for an PSA below 10.”

Editorial: What have we learned from the Partin table update?

The controversies surrounding a physician’s best treatment strategy advice to an individual patient with clinically localized prostate cancer create a continuing need for advanced statistics. Historically, the Partin tables [1] were one of the first statistical tools that physicians and patients found readily usable. The tables have been updated and always focused on prediction of pathologic stage from standard clinical variables. The next commonly cited/used tool was the Kattan nomogram [2] that carried the prediction the next step to the endpoint of biochemical relapse. By 2008, Shariat et al catalogued over 100 predictive tools published from 1966 to 2007 on various endpoints of prostate cancer [3].


What have we learned from this update of the Partin tables?

  1. The pre-operative grade distribution has shifted up slightly with no change in prostatectomy grade/stage distribution. The authors discuss possible causes such as changes in interpreting the Gleason scoring system, shifts in selection for surgery away from lower grade patients, and a possible plateau in stage migration.
  2. The tables have split off Gleason 3+4, 4+3, 8, and 9–10, and found the latter significantly more aggressive, while Gleason 4+3 and 4+4 are more similar. Gleason 9–10 must have a pattern 5 component >5% and may therefore have more aggressive biology. On the other hand, two cases of prostate cancer may have identical volumes of 4 pattern, but if one adds additional 3 pattern, that additional tumour foci paradoxically lowers the sum to 7, but perhaps not the risk of non-organ confined stage.
  3. In the past, the tables were commonly used to predict pT3 stage, with possible change in management away from surgery as that risk increased. Clearly the literature on surgery for higher risk disease has matured, and augmented by the adjuvant/salvage radiation literature such that it is less likely to use the tables for this reason any more. On the other hand, prediction of N1 disease for the purpose of omitting a lymph node dissection remains a useful tool. In this update, using a <2% cut-off you would essentially omit all node dissections in Gleason 6 with PSA < 10 and cT1c/cT2a, while continuing with a dissection for any dominant Gleason 4 pattern. It is noteworthy that this experience was largely based upon standard templates, and those advocating extended templates will find these N1 rates too low. Indeed, when our center adopted the extended template using a robotic technique, the N1 rate for high-risk disease was 39% and 9% for intermediate risk [4]. Moving forward, what tools do we need to provide useful statistics to our patients? Updating old tools with more contemporary patient cohorts is certainly a worthy exercise. Multicentre study based tools will be required for endpoints such as positive surgical margins, quality of life, biochemical recurrence, and other endpoints that may be significantly affected by the experience of the treating physician. Beyond this, the next step should be adaptive nomograms that update in real time rather than en masse every 4–5 years [5].

John W. Davis
Department of Urology, The University of Texas MD Anderson Cancer Center, Houston, TX, USA

References
1 Eifler JB, Feng Z, Lin BM et al. An updated prostate cancer staging nomogram (Partin tables) based on cases from 2006 to 2011. BJU Int 2013; 111: 26–33
2 Kattan MW, Eastham JA, Stapleton AM et al. A preoperative nomogram for disease recurrence following radical prostatectomy for prostate cancer. J Natl Cancer Inst 1998; 90: 766–71
3 Shariat SF, Karakiewicz PI, Roehborn CG, Kattan MW. An updated catalog of prostate cancer predictive tools. Cancer 2008; 113: 3075–99
4 Davis JW, Shah JB, Achim M. Robot-assisted extended pelvic lymph node dissection (PLND) at the time of radical prostatectomy (RP): a video-based illustration of technique, results, and unmet patient selection needs. BJUI 2011; 108: 993–8
5 Vickers AJ, Fearn P, Scardino PT et al. Why can’t nomograms be more like Neflix? Urology 2010; 75: 511–3

Read the full article

John Eifler and Alan Partin discuss their article

An updated prostate cancer staging nomogram (Partin tables) based on cases from 2006 to 2011.

John B. Eifler, Zhaoyang Feng, Brian M. Lin, Michael T. Partin, Elizabeth B. Humphreys, Misop Han, Jonathan I. Epstein, Patrick C. Walsh, Bruce J. Trock and Alan W. Partin
James Buchanan Brady Urological Institute and the Department of Urology, Johns Hopkins Medical Institutions, Baltimore, MD, USA

Objective

  • To update the 2007 Partin tables in a contemporary patient population.

Patients and Methods

The study population consisted of 5,629 consecutive men who underwent RP and staging lymphadenectomy at the Johns Hopkins Hospital between January 1, 2006 and July 30, 2011 and met inclusion criteria.

  • Polychotomous logistic regression analysis was used to predict the probability of each pathologic stage category: organ-confined disease (OC), extraprostatic extension (EPE), seminal vesicle involvement (SV+), or lymph node involvement (LN+) based on preoperative criteria.
  • Preoperative variables included biopsy Gleason score (6, 3+4, 4+3, 8, and 9–10), serum PSA (0–2.5, 2.6–4.0, 4.1–6.0, 6.1–10.0, greater than 10.0 ng/mL), and clinical stage (T1c, T2c, and T2b/T2c).
  • Bootstrap re-sampling with 1000 replications was performed to estimate 95% confidence intervals for predicted probabilities of each pathologic state.

Results

  • The median PSA was 4.9 ng/mL, 63% had Gleason 6 disease, and 78% of men had T1c disease.
  • 73% of patients had OC disease, 23% had EPE, 3% had SV+ but not LN+, and 1% had LN+ disease. Compared to the previous Partin nomogram, there was no change in the distribution of pathologic state.
  • The risk of LN+ disease was significantly higher for tumors with biopsy Gleason 9–10 than Gleason 8 (O.R. 3.2, 95% CI 1.3–7.6).
  • The c-indexes for EPE vs. OC, SV+ vs. OC, and LN+ vs. OC were 0.702, 0.853, and 0.917, respectively.
  • Men with biopsy Gleason 4+3 and Gleason 8 had similar predicted probabilities for all pathologic stages.
  • Most men presenting with Gleason 6 disease or Gleason 3+4 disease have <2% risk of harboring LN+ disease and may have lymphadenectomy omitted at RP.

Conclusions

  • The distribution of pathologic stages did not change at our institution between 2000–2005 and 2006–2011.
  • The updated Partin nomogram takes into account the updated Gleason scoring system and may be more accurate for contemporary patients diagnosed with prostate cancer.

Eifler JB, Feng Z, Lin BM, et al. An updated prostate cancer staging nomogram (Partin tables) based on cases from 2006 to 2011. BJU Int 2013; 111: 26–33.

Read the full article
© 2025 BJU International. All Rights Reserved.