Tag Archive for: growth periods

Posts

Article of the Week: Multiple Growth Periods of SRMs Predict Unfavourable Pathology

Every Week, the Editor-in-Chief selects an Article of the Week from the current issue of BJUI. The abstract is reproduced below and you can click on the button to read the full article, which is freely available to all readers for at least 30 days from the time of this post.

In addition to the article itself, there is an accompanying editorial written by a prominent member of the urological community. This blog is intended to provoke comment and discussion and we invite you to use the comment tools at the bottom of each post to join the conversation.

Finally, the third post under the Article of the Week heading on the homepage will consist of additional material or media. This week we feature a video discussing the paper.

If you only have time to read one article this week, it should be this one.

Multiple growth periods predict unfavourable pathology in patients with small renal masses

Alex Jang , Hiten D. Patel, Mark Riffon, Michael A. Gorin , Alice SemerjianMichael H. Johnson, Mohamad E. Allaf and Phillip M. Pierorazio


Department of Urology, James Buchanan Brady Urological Institute, Johns Hopkins University School of Medicine, Baltimore, MD, USA


Abstract

Objective

To use the number of positive growth periods as a characterization of the growth of small renal masses in order to determine potential predictors of malignancy.

Patients and Methods

Patients who underwent axial imaging at multiple time points prior to surgical resection for a small renal mass were queried. Patients were categorized based on their pathological tumour grade and stage: favourable (benign, chromophobe and low‐grade pT1–2 renal cell carcinoma [RCC]) vs unfavourable (high‐grade of any stage and low‐grade pT3–4 RCC). A positive growth period was counted each time the difference in greatest tumour diameters between two images was positive. The Cochran–Armitage trend test and Somers’ D association were used to determine if the number of positive growth periods was correlated with unfavourable pathology.

Results

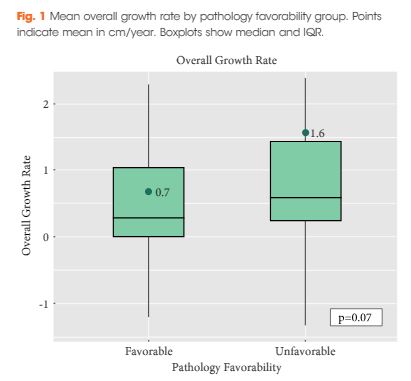
Of the 124 patients, 86 (69.4%) had favourable pathology and 38 (30.6%) had unfavourable pathology. Those who had favourable pathology were younger than those who had unfavourable pathology: median (interquartile range [IQR]) 61.0 (52.2–66.0) vs 68.5 (61.5–77.0); P < 0.001. The overall growth rate was higher in the unfavourable group, but was not statistically significant: mean (sd) 0.7 (1.7) vs 1.6 (2.8) cm/year; P = 0.07. There was a significant trend difference in the number of positive growth periods between favourability groups (P = 0.02). An association between increased number of positive growth periods and unfavourable pathology was observed: 0.15 (95% confidence interval 0.02, 0.29). The ratios of favourable to unfavourable pathology were 1.8, 1.0, 0.66, 0.59 and 0 as the number of positive growth periods increased from 0 to 4, respectively.

Conclusion

While overall growth rate was not predictive of pathology favourability, there was a positive association between the number of positive growth periods and unfavourable pathology. The number of positive growth periods may be a potential parameter for malignant potential in patients undergoing active surveillance for small renal masses.

Editorial: Growth spurts of small renal masses correlate with pathology

A rapid growth rate has long been known to be a harbinger of aggressive tumour pathology and clinical behaviour of small renal masses (SRMs) 1. However, this association has not been confirmed in prospective studies of patients with SRMs on active surveillance (AS) 2. Jewett et al. 2, in a multicentre prospective phase 2 clinical trial of 209 patients with a SRM, found that despite an average growth rate of 0.13 cm/year, pathology did not impact growth. Clinically, the growth rates of SRMs are most commonly variable, rather than the assumed steady slow growing rate that is often reported 3. Due to the discrepancies in the literature, the use of average growth rate for a SRM can be misleading. Finding a clinically effective tool to identify potentially aggressive cancers remains an important (and unmet) need for patients undergoing AS.

Jang et al. 4 provide insight into this need by evaluating the number of growth periods over time as a risk factor for renal masses under surveillance. They retrospectively reviewed renal masses that were initially <4 cm at diagnosis and were followed for a variable time period before undergoing surgical therapy. Two cohorts were grouped into ‘favourable‐’ (benign tumours, chromophobe RCC and low grade, pT1–2 RCC) and ‘unfavourable’‐risk tumours (high‐grade RCC of any stage and low‐grade, pT3–4 RCC), finding no difference in the amount of interval imaging between the two groups. There was a significant difference in the number of positive growth periods between the ‘favourable’ and ‘unfavourable’ pathology groups (P = 0.02) for the entire cohort (all pT stages) and a similar finding when examining only pT1a tumours (P < 0.05). Additionally, there was a positive association between increased number of positive growth periods and unfavourable pathology (odds ratio 0.15, 95% CI 0.02–0.29).

Active surveillance is considered an acceptable initial option for the management of all patients with SRMs, not just those with limited life expectancy or poor performance, as highlighted in the 2017 AUA guidelines 5. Optimal management of patients on AS would appear to require a good understanding of growth kinetics, pathological details, and risk–benefit analysis. The previously held dogma of using linear growth rate as a guide for the aggressiveness of a tumour has been challenged recently 6 and again put into question by this study 4. The Delayed Intervention and Surveillance for Small Renal Masses (DISSRM) study showed that there was a higher growth rate in patients who had delayed intervention compared with those on AS, but there was no significant association (P = 0.15) 6. However, in the same study, the proportion of patients who had a positive growth rate (>0 cm/year) or a recorded ‘growth spurt’ were significantly more likely to have delayed intervention than AS patients (P < 0.01) 6.

Growth spurts, rather than growth rate over time, as a marker for malignancy, correlates best with clinical experience. Average growth rate can be artificially high with one large growth and multiple stable imaging intervals. One of the important elements of AS is regular interval imaging. The development of protocols that can be evaluated to determine the optimal type, interval, and duration of follow‐up imaging is a clinical need in this space. Whilst the cohort from Jang et al. 4 did not have regular intervals for imaging, there were an equal number of studies performed on patients with ‘favourable’ and ‘unfavourable’ pathology. Without clear protocols, using growth spurts rather than growth rate, also provides a simplified message for patients and will aid in counselling.

The identification of growth spurts as a risk factor for potentially aggressive features of SRMs under surveillance provides a useful tool when determining the need for intervention of a SRM. The uniform reporting of pathological data for patients under study is a strength, but several weaknesses limit the generalisability of the findings including the retrospective study design and inconsistent manner in which AS was performed. The clinical impact of growth spurts in the AS population warrants further investigation before definitive conclusions can be drawn.

Conrad M. Tobert* and Brian R. Lane
*Department of Urology, University of Iowa, Iowa City, IAUSA, Division of Urology, Spectrum Health Medi cal GroupGrand Rapids, MI, USA and Michigan State University College of Human Medicine, Grand Rapids, MI, USA


References
  • Lee SW, Sung HH, Jeon HG et al. Size and volumetric growth kinetics of renal masses in patients with renal cell carcinomaUrology 201690: 119–24


  • Chawla SN, Crispen PL, Hanlon AL, Greenberg RE, Chen DY, Uzzo RG. The natural history of observed enhancing renal masses: meta‐analysis and review of the world literatureJ Urol 2006175: 425–31


  • Jang A, Patel HD, Riffon M et al. Multiple growth periods predict unfavourable pathology in patients with small renal massesBJU Int 2018121: 732–6


Video: Multiple Growth Periods of SRMs Predict Unfavourable Pathology


Multiple growth periods predict unfavourable pathology in patients with small renal masses


Abstract

Objective

To use the number of positive growth periods as a characterization of the growth of small renal masses in order to determine potential predictors of malignancy.

Patients and Methods

Patients who underwent axial imaging at multiple time points prior to surgical resection for a small renal mass were queried. Patients were categorized based on their pathological tumour grade and stage: favourable (benign, chromophobe and low‐grade pT1–2 renal cell carcinoma [RCC]) vs unfavourable (high‐grade of any stage and low‐grade pT3–4 RCC). A positive growth period was counted each time the difference in greatest tumour diameters between two images was positive. The Cochran–Armitage trend test and Somers’ D association were used to determine if the number of positive growth periods was correlated with unfavourable pathology.

Results

Of the 124 patients, 86 (69.4%) had favourable pathology and 38 (30.6%) had unfavourable pathology. Those who had favourable pathology were younger than those who had unfavourable pathology: median (interquartile range [IQR]) 61.0 (52.2–66.0) vs 68.5 (61.5–77.0); P < 0.001. The overall growth rate was higher in the unfavourable group, but was not statistically significant: mean (sd) 0.7 (1.7) vs 1.6 (2.8) cm/year; P = 0.07. There was a significant trend difference in the number of positive growth periods between favourability groups (P = 0.02). An association between increased number of positive growth periods and unfavourable pathology was observed: 0.15 (95% confidence interval 0.02, 0.29). The ratios of favourable to unfavourable pathology were 1.8, 1.0, 0.66, 0.59 and 0 as the number of positive growth periods increased from 0 to 4, respectively.

Conclusion

While overall growth rate was not predictive of pathology favourability, there was a positive association between the number of positive growth periods and unfavourable pathology. The number of positive growth periods may be a potential parameter for malignant potential in patients undergoing active surveillance for small renal masses.

© 2025 BJU International. All Rights Reserved.