Tag Archive for: grade re-classification

Posts

Editorial: Are historical studies relevant in the setting of grade migration?

While randomized controlled trials are the ‘gold standard’ for comparative effectiveness research, it is important that they be taken in context of their limitations. This is especially true in surgical trials for prostate cancer. For one, factors such as blinding and allocation concealment are often impossible in surgery, and surgeon skill may have a large impact [1]. What is more, it can take over a decade before interventions yield detectable differences in prostate cancer survival. Consequently, shifts in diagnosis and management may make historical clinical trial findings less useful for contemporary patients. For example, the landmark Scandinavian Prostate Cancer Group Study number 4 (SPCG‐4) showed a survival benefit for men treated with radical prostatectomy rather than observation during the 1989–1999 time period [2] but management in the study differed from contemporary practice as, in the 1990s, strict ‘active surveillance’ protocols did not exist.

In addition to shifts in management, men diagnosed with prostate cancer today differ from those diagnosed in previous decades. This was shown by Dalela et al. [3] who compared registry‐based data from the USA with data on patients enrolled in the Prostate Cancer Intervention Versus Observation (PIVOT) trial, and found significant differences between the two cohorts.

In a similar vein, Cazzaniga et al. [4] designed an elegant study to assess the generalizability of the SPCG‐4 to contemporary cohorts of men with prostate cancer. They focused on histological grading and compared the natural history of men in the SPCG‐4 study to men in similar grade categories diagnosed approximately one decade later in Sweden.

The contemporary cohort was made up of men with localized prostate cancer drawn from the Swedish National Prostate Cancer Register (NPCR). Men in the NPCR diagnosed in 2005–2006 had lower prostate cancer‐specific and all‐cause mortality compared to men with similar grade cancer in the SPCG‐4 (hazard ratios 0.46, 95% CI 0.19–1.14, and 0.66, 95% CI 0.46–0.95, respectively). While some of the observed differences in survival may have been attributable to improved treatments, Cazzaniga et al. hypothesized that grade migration was to blame.

As expected, the authors found a shift in Gleason grading, with a decrease in Gleason Grade Group (GGG) 1 disease, corresponding to a historical score of Gleason 3 + 3 = 6, and a concurrent increase in GGG2 and GGG3 disease, corresponding to historical scores of 3 + 4 = 7 and 4 + 3 = 7, respectively. Importantly, these differences in prostate cancer‐specific and all‐cause mortality were mitigated after compensating for grade migration by increasing GGG by one for the NPCR group; in other words, men in the SPCG‐4 treated in the 1990s had similar prostate cancer‐specific and all‐cause mortality to men in a later period with a one‐unit higher GGG.

Grade migration has been a gradual process, which was hastened by the major 2005 International Society of Urological Pathology revision that recategorized some Gleason patterns from 3 to 4. Changes in 2014 further refined these, and the concept of grade groups was introduced by Epstein two years later. Older cases of Gleason score 6 cancer include histological patterns, such as cribriform and poorly formed glands, which today would be considered Gleason pattern 4.

Grade migration was also demonstrated by Danneman et al. [5] who analysed the Gleason scoring of prostate biopsies from the NPCR in Sweden for the period 1998–2011. There was an increasing incidence of low‐risk cancer (cT1 20% in 1998 to 51% in 2011) and a concurrent decrease in high‐risk cancers (cT3 29% to 16%), reflecting earlier detection. With earlier diagnosis from screening, one would expect a shift towards lower grades at diagnosis, but they found the opposite. Among low‐risk tumours (stage cT1 and PSA 4–10 ng/mL) the proportion of Gleason score 7–10 increased from 16% to 40%. Among high‐risk tumours (stage cT3 and PSA 20–50 ng/mL) the proportion of Gleason 7–10 increased from 65% to 94%.

Gleason score reclassification was also addressed by Albertsen et al. [6], who had prostate biopsy slides for the period 1990 to 1992 re‐reviewed by an experienced pathologist in 2002–2004. They found an upward shift in Gleason grading, with 55% of the samples upgraded, 14% downgraded, and 31% unchanged. Comparing matched cohorts of historical vs contemporary patients with prostate cancer, one might erroneously infer better survival. This illusory change in prognosis is known as the ‘Will Rogers phenomenon’.

While randomized trials such as the SPCG‐4 represent one of the highest levels of clinical evidence, it is important to keep in mind that these trials have limitations. Given the interval changes in grading criteria for prostatic adenocarcinoma, predicting clinical outcomes based on historical cohorts is rarely as simple as it may seem. While the fundamental conclusions of the SPGC‐4 remain valid, the finding that Gleason grade did not modify the effect of prostatectomy on survival is now less certain. Physicians should therefore use caution when inferring prognosis based on those results.

Cazzaniga et al. should be congratulated for this important work which will help physicians better counsel patients making decisions based on trials like the SPCG‐4.

References

  1. Trinh QD, Cole AP, Dasgupta P. Weighing the evidence from surgical trials. BJU Int 2017; 119: 659–60
  2. Bill‐Axelson A, Holmberg L, Ruutu M et al. Radical prostatectomy versus watchful waiting in early prostate cancer. N Engl J Med 2011; 364: 1708–17
  3. Dalela D, Karabon P, Sammon J et al. Generalizability of the Prostate Cancer Intervention Versus Observation Trial (PIVOT) results to contemporary North American men with prostate cancer. Eur Urol 2017; 71: 511–4
  4. Cazzaniga W, Garmo H, Robinson D, Holmberg L, Bill‐Axelson A, Stattin P. Mortality after radical prostatectomy in a matched contemporary cohort in Sweden compared to the Scandinavian Prostate Cancer Group 4 (SPCG‐4) study. BJU Int 2019; 123: 421–8
  5. Danneman D, Drevin L, Robinson D, Stattin P, Egevad LJ. Gleason inflation 1998–2011: a registry study of 97,168 men. BJU Int 2015; 115: 248–55
  6. Albertsen PC, Hanley JA, Barrows GH et al. Prostate cancer and the Will Rogers phenomenon. J Natl Cancer Inst 2005; 97: 1248–53C


Article of the Week: Risk prediction tool for grade re-classification in men with favourable-risk prostate cancer on active surveillance

Every Week the Editor-in-Chief selects an Article of the Week from the current issue of BJUI. The abstract is reproduced below and you can click on the button to read the full article, which is freely available to all readers for at least 30 days from the time of this post.

In addition to the article itself, there is an accompanying editorial written by a prominent member of the urological community. This blog is intended to provoke comment and discussion and we invite you to use the comment tools at the bottom of each post to join the conversation.

If you only have time to read one article this week, it should be this one.

Risk prediction tool for grade re-classification in men with favourable-risk prostate cancer on active surveillance

Mufaddal M. Mamawala, Karthik Rao, Patricia Landis, Jonathan I. EpsteinBruce J. Trock, Jeffrey J. Tosoian, Kenneth J. Pienta and H. Ballentine Carter


The James Buchanan Brady Urological Institute, Johns Hopkins Medical Institutions, Baltimore, MD, USA

Read the full article


How to Cite

Mamawala, M. M., Rao, K., Landis, P., Epstein, J. I., Trock, B. J., Tosoian, J. J., Pienta, K. J. and Carter, H. B. (2017), Risk prediction tool for grade re-classification in men with favourable-risk prostate cancer on active surveillance. BJU International, 120: 25–31. doi: 10.1111/bju.13608

Objective

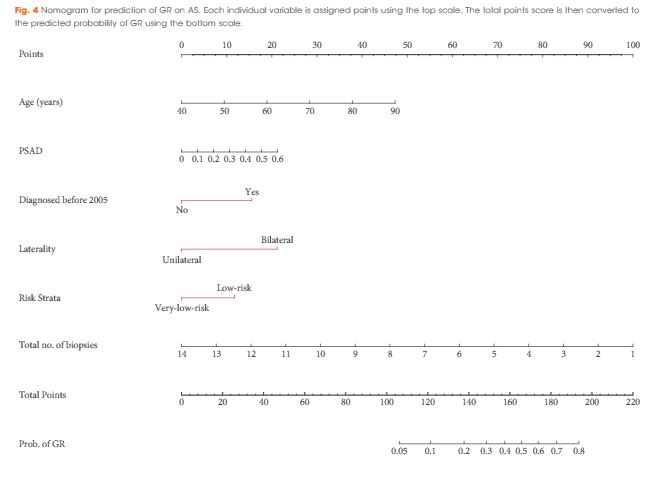
To create a nomogram for men on active surveillance (AS) for prediction of grade re-classification (GR) above Gleason score 6 (Grade group >2) at surveillance biopsy.

Patients and Methods

From a cohort of men enrolled in an AS programme, a multivariable model was used to identify clinical and pathological parameters predictive of GR. Nomogram performance was assessed using receiver operating characteristic curves, calibration, and decision curve analysis.

aotw-jul-2017-5-results

Results

Of 1 374 men, 254 (18.50%) were re-classified to Gleason ≥7 on surveillance prostate biopsy. Variables predictive of GR were earlier year of diagnosis [≤2004 vs ≥2005; odds ratio (OR) 2.16, P < 0.001], older age (OR 1.05, P < 0.001), higher prostate-specific antigen density [OR 1.19 (per 0.1 unit increase), P = 0.04], bilateral disease (OR 2.86, P < 0.001), risk strata (low-risk vs very-low-risk, OR 1.79, P < 0.001), and total number of biopsies without GR (OR 0.68, P < 0.001). On internal validation, a nomogram created using the multivariable model had an area under the curve of 0.757 (95% confidence interval 0.730–0.797) for predicting GR at the time of next surveillance biopsy.

Conclusion

The nomogram described is currently being used at each return visit to assess the need for a surveillance biopsy, and could increase retention in AS.

Read more articles of the week

Editorial: Shift from protocol-based to personalized medicine in active surveillance: beginning of a new era

The use of active surveillance (AS) is rapidly expanding worldwide, with rates as high as 74% among patients with low-risk prostate cancer in the nationwide registry of Sweden [1]. Despite increasing uptake of this strategy by patients, there is no consensus among the medical community as to the ideal criteria for selection and monitoring [2]. For example, the Johns Hopkins AS programme restricts enrolment to men with low-risk disease and performs annual biopsies for monitoring. Other protocols also include men with intermediate-risk disease and perform prostate biopsy at less frequent intervals.

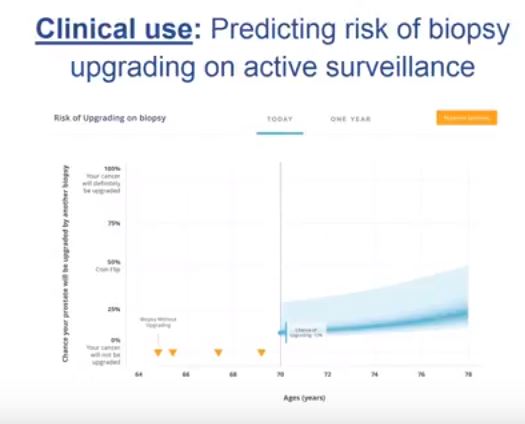
Is it really optimal to use the same follow-up protocol for all patients? Many factors influence the risk of reclassification, including patient characteristics (e.g. race, body mass index) and disease features (e.g. PSA density, Gleason score and extent of disease on biopsy) [3]. Moreover, previous studies have shown that the risk of reclassification during AS is a conditional probability, where the risk decreases with each additional negative biopsy [4]. Given that individual patients have vastly different risks of reclassification, and that the risk changes over time, AS represents an ideal context for personalized medicine.

There has already been a significant paradigm shift in prostate cancer screening from a one-size-fits-all to a multivariable, risk-adapted approach [5]. Why would we use the same screening intervals and biopsy cutoff for patients with vastly different risk profiles? Multiple guidelines already recommend using PSA levels to guide screening protocols, and there are several validated multivariable tools to provide more personalized estimates of prostate cancer risk. Both the Prostate Cancer Prevention Trial (PCPT) and the European Randomised Study of Screening for Prostate Cancer (ERSPC) risk calculators have been extensively studied and are readily available online for use in clinical practice [6].

To date, the concept of risk-adapted AS has received relatively little attention, and few nomograms have been created specifically for the AS population. Using data from the Canary Prostate Active Surveillance Study (PASS), Ankerst et al. [7] designed a nomogram to predict biopsy reclassification using age at biopsy, months since the last biopsy, last PSA level, percentage of cores positive for cancer on the last biopsy, and number of previous negative biopsies. This tool had an area under the curve (AUC) of 0.724 on internal validation, and is available online at https://prostate-cancer-risk-calculator.org to facilitate additional validation and clinical use.

In the current issue of BJUI, Mamawala et al. [8] report on the development of another new AS nomogram using data from the Johns Hopkins programme. Specifically, the tool predicts the risk of biopsy reclassification using six variables: age; PSA density; year of diagnosis; laterality; risk strata; and total number of biopsies. The nomogram was well calibrated and had an AUC of 0.757 on internal validation. Notably, the same authors have also recently developed a different tool to predict pathological Gleason score for men on AS using a Bayesian joint model [9]. Following external validation, these tools may help provide more customized decision support for the AS population by integrating longitudinal data.

It is noteworthy that none of these nomograms incorporate new markers or imaging, and it is likely that such data could further refine their estimates. For example, longitudinal measurements of the Prostate Health Index were previously shown to predict biopsy reclassification during AS [10], and the use of multiparametric MRI continues to expand. As more data on these tests become available, the AS risk calculators should be updated, as has been done with the PCPT and ERSPC risk calculators used in the screening context. In the future, continued research on genetics may allow further tailoring of AS. In the meantime, these risk calculators are an important first step (‘version 1.0’) toward a more personalized approach to AS.

Stacy Loeb


Department of Urology, Population Health, Laura & Isaac Perlmutter Cancer Center, New York University, New YorkNY, US

Read the full article


References


1 Loeb S, Folkvaljon Y, Curnyn C, Robinson D, Bratt O, Stattin P. Almost complete uptake of active surveillance for very low-risk prostate cancer in Sweden. JAMA Oncol 2016; [Epub ahead of print]. doi: 10.1001/ jamaoncol.2016.3600


2 Tosoian JJ, Carter HB, Lepor A, Loeb S. Active surveillance for prostate cancer: current evidence and contemporary state of practice. Nat Rev Urol 2016; 13: 20515


4 Alam R, Carter HB, Landis P, Epstein JI, Mamawala M. Conditional probability of reclassication in an active surveillance program for prostate cancer. J Urol 2015; 193: 19505


9 ColeyRY, Zeger S L, Mamawala M, Pienta KJ, Carter HBPrediction of the pathologic gleason score to inform a personalized management program for prostate cancer. Eur Urol 2016; [Epub ahead of print]. doi: 10.1016/j.eururo.2016.08.005


Video: Risk prediction tool for grade re-classification in men with favourable-risk prostate cancer on active surveillance

Risk prediction tool for grade re-classification in men with favourable-risk prostate cancer on active surveillance

Read the full article

Abstract

Objective

To create a nomogram for men on active surveillance (AS) for prediction of grade re-classification (GR) above Gleason score 6 (Grade group >2) at surveillance biopsy.

Patients and Methods

From a cohort of men enrolled in an AS programme, a multivariable model was used to identify clinical and pathological parameters predictive of GR. Nomogram performance was assessed using receiver operating characteristic curves, calibration, and decision curve analysis.

Results

Of 1 374 men, 254 (18.50%) were re-classified to Gleason ≥7 on surveillance prostate biopsy. Variables predictive of GR were earlier year of diagnosis [≤2004 vs ≥2005; odds ratio (OR) 2.16, P < 0.001], older age (OR 1.05, P < 0.001), higher prostate-specific antigen density [OR 1.19 (per 0.1 unit increase), P = 0.04], bilateral disease (OR 2.86, P < 0.001), risk strata (low-risk vs very-low-risk, OR 1.79, P < 0.001), and total number of biopsies without GR (OR 0.68, P < 0.001). On internal validation, a nomogram created using the multivariable model had an area under the curve of 0.757 (95% confidence interval 0.730–0.797) for predicting GR at the time of next surveillance biopsy.

Conclusion

The nomogram described is currently being used at each return visit to assess the need for a surveillance biopsy, and could increase retention in AS.

View more videos

© 2024 BJU International. All Rights Reserved.